
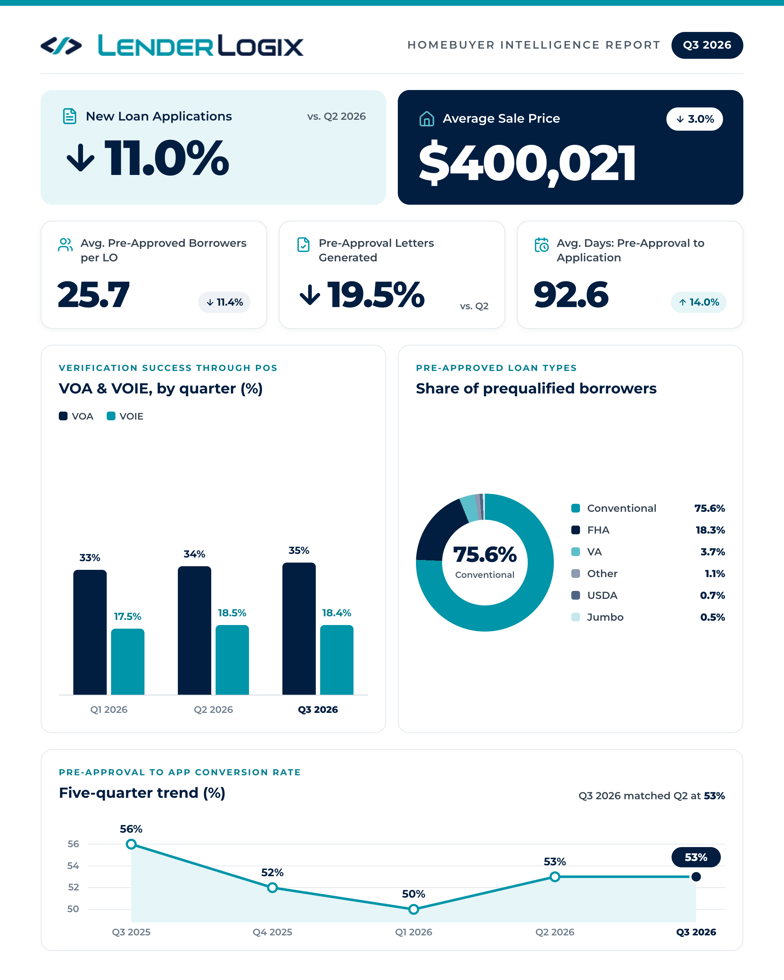
Each quarter, LenderLogix analyzes borrower activity across its LiteSpeed platform to track how homebuyers are shopping, qualifying, and moving toward a mortgage application. In Q3 2026, the average buyer spent about 93 days between pre-approval and application, and 53% of QuickQuals went on to become loan applications.
The clearest signal in Q3 is how little a longer decision window affected conversion. Overall platform activity was lighter than in Q2 and buyers took more time to commit, yet the QuickQual to loan application conversion rate matched last quarter at 53%.
Borrowers Kept Coming Back to Their Numbers
Q3 2026 borrowers logged in an average of 7.15 times during the quarter, returning to their pre-approval tool as they searched for a home. Total activity was lighter than in the spring. Borrower logins fell about 26% from Q2, pre-approval letters generated dropped about 19%, and new QuickQuals created were down about 17%.
On the loan officer side, the average LO with an active shopper was working with 25.7 pre-approved borrowers, compared to 29.0 in Q2. The number of loan officers with an active shopper was nearly unchanged from last quarter.
The Average Buyer Shopped Just Above $400,000
The average sale price among Q3 borrowers was $400,021, with an average mortgage amount of $338,894, both about 3% below Q2. The average maximum monthly payment came in at $3,156, and average maximum total cash was $202,719.
Buyers put down an average of about 15.28%, nearly identical to Q2, and the average fee collected through the platform was $820. Conventional financing accounted for 75.6% of prequalified borrowers, followed by FHA at 18.3% and VA at 3.7%. USDA, Jumbo, and other loan types each made up less than 2% of the total.
A Longer Path to Application, With No Drop in Conversion
The average time from QuickQual to loan application stretched to about 93 days in Q3, up from about 81 in Q2. That extra time didn't show up as lost borrowers. The QuickQual to loan application conversion rate was 53%, the same as last quarter, and borrowers who converted generated an average of 8.3 pre-approval letters before applying, also unchanged.
Some buyers took far longer than average. The longest span between QuickQual and loan approval reached 698 days, a reminder that extended shopping and financing timelines are part of the picture for a portion of every pipeline.
Applications Followed the Front End as VOA Success Climbed
Activity after the application moved in line with what happened earlier in the funnel. New LiteSpeed applications were down about 11% from Q2, document uploads declined by nearly the same margin, and total Needs Lists created fell about 8%.
Successful POS VOA completions reached 35%, up from 34% in Q2 and the second consecutive quarterly gain. Successful POS VOIE completions came in at 18.4%, a tenth of a point below Q2.
What This Means for Lenders Heading Into Q4
Q3 2026 data points to buyers who are deliberate rather than disengaged. They logged in repeatedly, generated multiple letters, and took their time, but converted to applications at the same rate as they did in Q2.
For lenders heading into Q4, the number worth watching is that 93-day window. Over a three-month search, a buyer's target price and payment comfort can shift more than once. QuickQual is built for that stretch of the process, letting borrowers run different scenarios and update their pre-qualification or pre-approval letters as they shop, as long as they stay within the parameters set by their loan officer. That keeps buyers moving on their own timeline while freeing up loan officers' time for revenue-generating work.